LiDAR Remote Sensing and 3D Visualization of Woodlots
Remote sensing is the scanning of earth by sensors stationed on a satellite or aircraft. To create a 3D visualization of woodlots in the Larose Forest, the area was scanned using a Light Detection and Ranging method of remote sensing. Light Detection and Ranging, or LiDAR for short, uses light in the form of a pulsed laser to measure the height of objects relative to the surface of the earth. The height of objects are determined by the time it takes for the light pulsed laser from the sensor to hit earth and then be bounced back and received by the sensor.
LiDAR Point Cloud Data Processing
Point cloud data was acquired through CRIBE’s ArcGIS Enterprise, where it was then downloaded to a local hard drive and unzipped using the LAStools Software. Once the point cloud data was unzipped, the 45Gb LiDAR point cloud tile set brought into ArcGIS Pro. Two subset LAS Datasets were created from the initial tile set covering woodlot 22A and 25B.
Point cloud data received from our client was unclassified, and therefore the team ran a classification process on both LAS datasets to classify point clouds into overlap, noise, ground, buildings, and vegetation classes.
3D Visualizations of Woodlots
Once point clouds were classified, topological data was integrated into the two 3D scene in ArcGIS Pro, including trail networks, alternative trails, watercourses, waterbodies, and roadways. Created 3D scenes of the woodlots were then shared as web scenes to ArcGIS Online to be embedded into the final product, the Experience Builder web application.
Fly-Over Video of Woodlots
Using the created 3D scenes, a fly-over video was created in ArcGIS Pro over the woodlot 25B. The video showcased the woodlot boundary, the section of trail impacted by planned forestry operations, and the proposed location of the alternative trail.
Initially, bookmarks were made of all scenes to be displayed of the 3D scene of the Larose Forest during the fly- over video. Next, the camera was arranged in each book marked scene to highlight a certain aspect such as the open and closed trails. These scenes were added into the video/animation as key frames. Lastly, the fixed transition method was chosen to allow the camera to pan smoothly between frames.
Spatial Analyses
Two different analyses were carried out. The first focused on determining alternative trail locations for trails where logging will have a significant impact and the existing trail could no longer be used. The second centered on demonstrating how GIS could be used to calculate potential income from logging.
Trail Re-routing Analysis: Determining Where Harvesting Will Take Place
The client provided a polygon layer of all the forest woodlots. Detailed information for each woodlot included the year of proposed harvesting as well as the suggested harvest method. The client requested we investigate only the woodlots that are in the current 5-year operations plan (spanning the years 2021 to 2025), and requested we focus exclusively on the 2022-2025 time frame. The woodlot (polygons), trailheads (points), and trails (polyline data supplied by UCPR) would serve as the primary operational layers in this application, in addition to reference data extracted from Ontario GeoHub (watercourses, water bodies, roads, and soils) and UCPR (aerial imagery).
Upon further discussion with the client and the UCPR forest manager, the decision was made to focus on hiking and biking trails since these are the most popular trails, and the ones most impacted by trail closures. So although some woodlots are being harvested in the 2022-2025 time frame, if they have no trails or if there are trails that are not hiking or cycling, they were not considered for analysis. If portions of the recreational trails are affected, a least cost path analysis was carried out to suggest an alternative route for a trail by-pass. The team created a weighted cost surface of the Larose Forest from the criteria listed below that will influence trail quality.
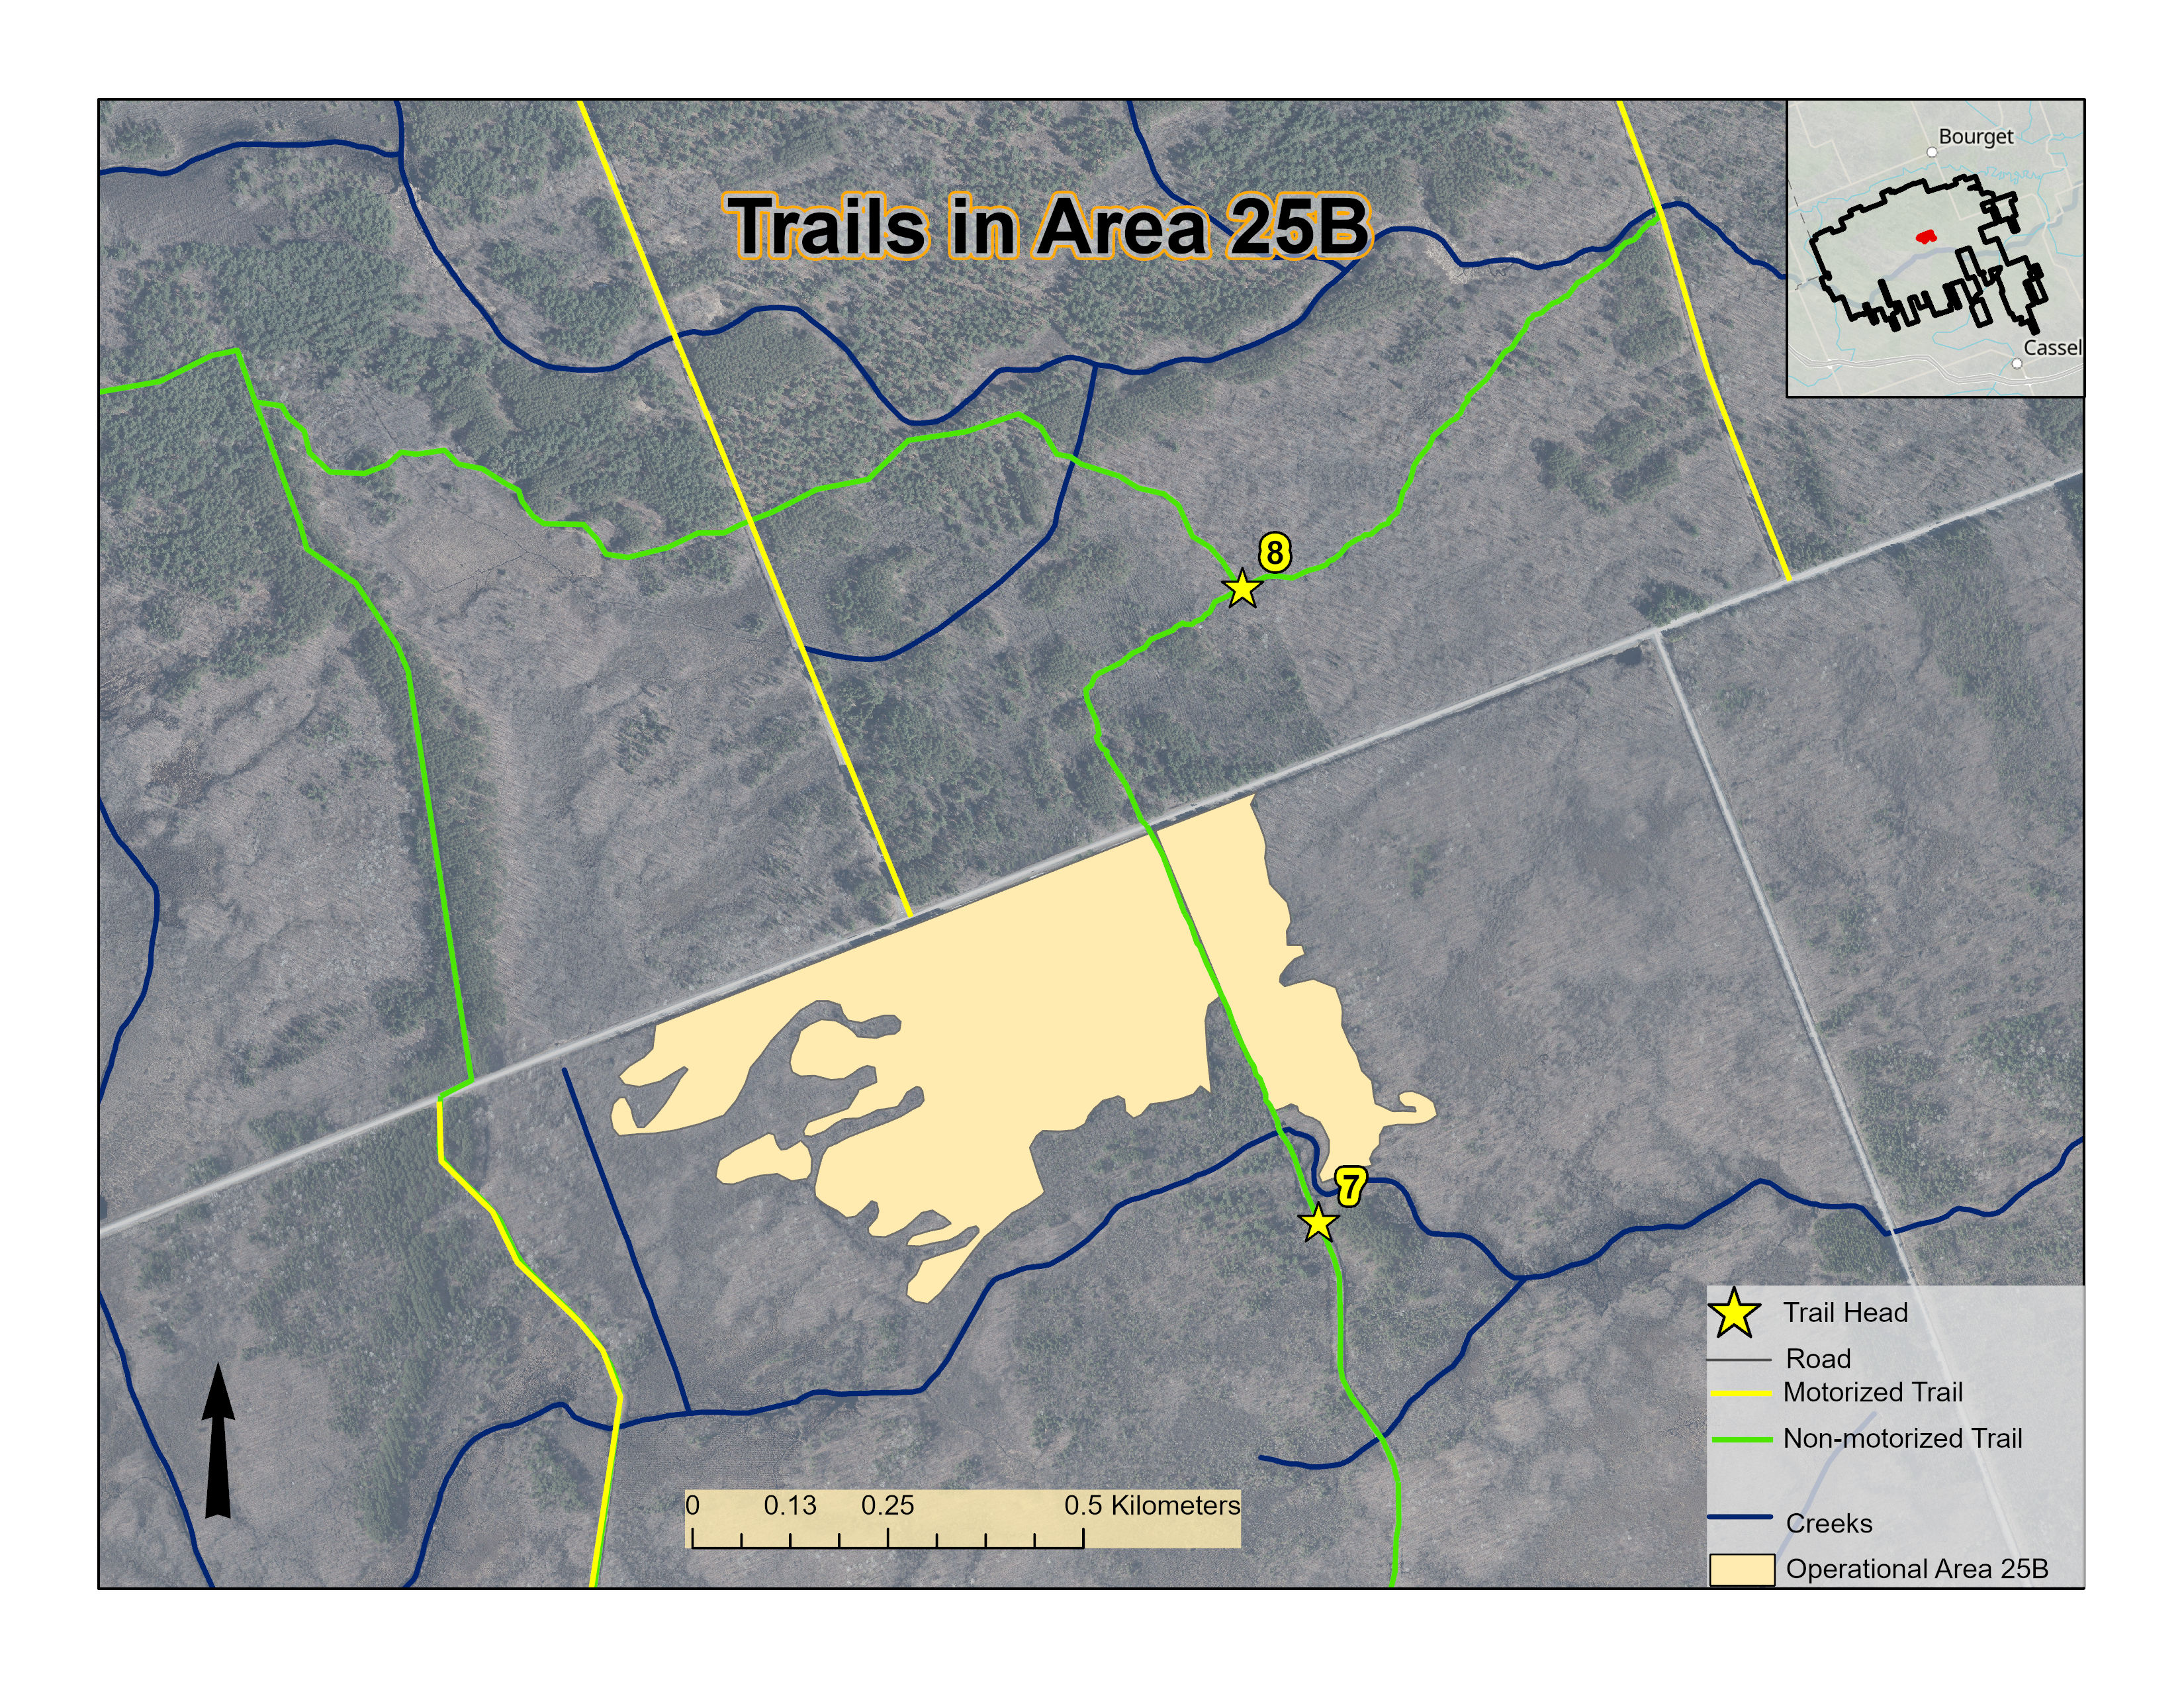
The figure below shows the existing trail in an area scheduled for logging in 2025.
Trail Re-routing Analysis: Parameters for Analysis
These parameters were investigated as inputs for the least cost path analysis:
- Distance to Water since cyclists/hikers don't want trails to be in water.
- Distance to Roads: Trails start and end at roads, but no one wants a trail to be right up against a road.
- Distance to Buildings: neither cyclists/hikers nor property owners watn trails to be right up against a property.
- Soil Drainage: the trails should be on dry ground, to minimize erosion.
- Age of Trees within Woodlots: the public want to experience time in a forest and preder not be to in open meadows. Forest managers wish to keep the public away from trampling newly-planted seedlings.
- Ground Slope: To minimize the possibility of a wet trail, areas with less than 1% slope were deemed undesirable since they likely have poor overland drainage.
- Type of Proposed Harvesting: Some forestry operations are more intensive than others. Clear cutting, for instance, has a larger impact on trail use than selecting thinning.
- Year of Proposed Harvesting: If a trail is to be re-routed, it should not be placed where future harvesitng will occur in the near future.
Income Analysis: Calculating Logging Income
Calculating income is usually carried out by professional foresters, using data such as tree species, age, health, height, biomass, end use product, etc. For this project, the team's goal was to create a simple GIS model to demonstrate how geo-referenced forestry data could be used to derive income. The demonstration model is based solely on tree age, using estimated income values provided by the client. Should prices change from year to year, a simple change to the unit rate re-calculates potential income to revised current values. Having this information, the client can show to the public the financial benefits of harvesting that could potentially be re-invested back into Larose Forest infrastructure.
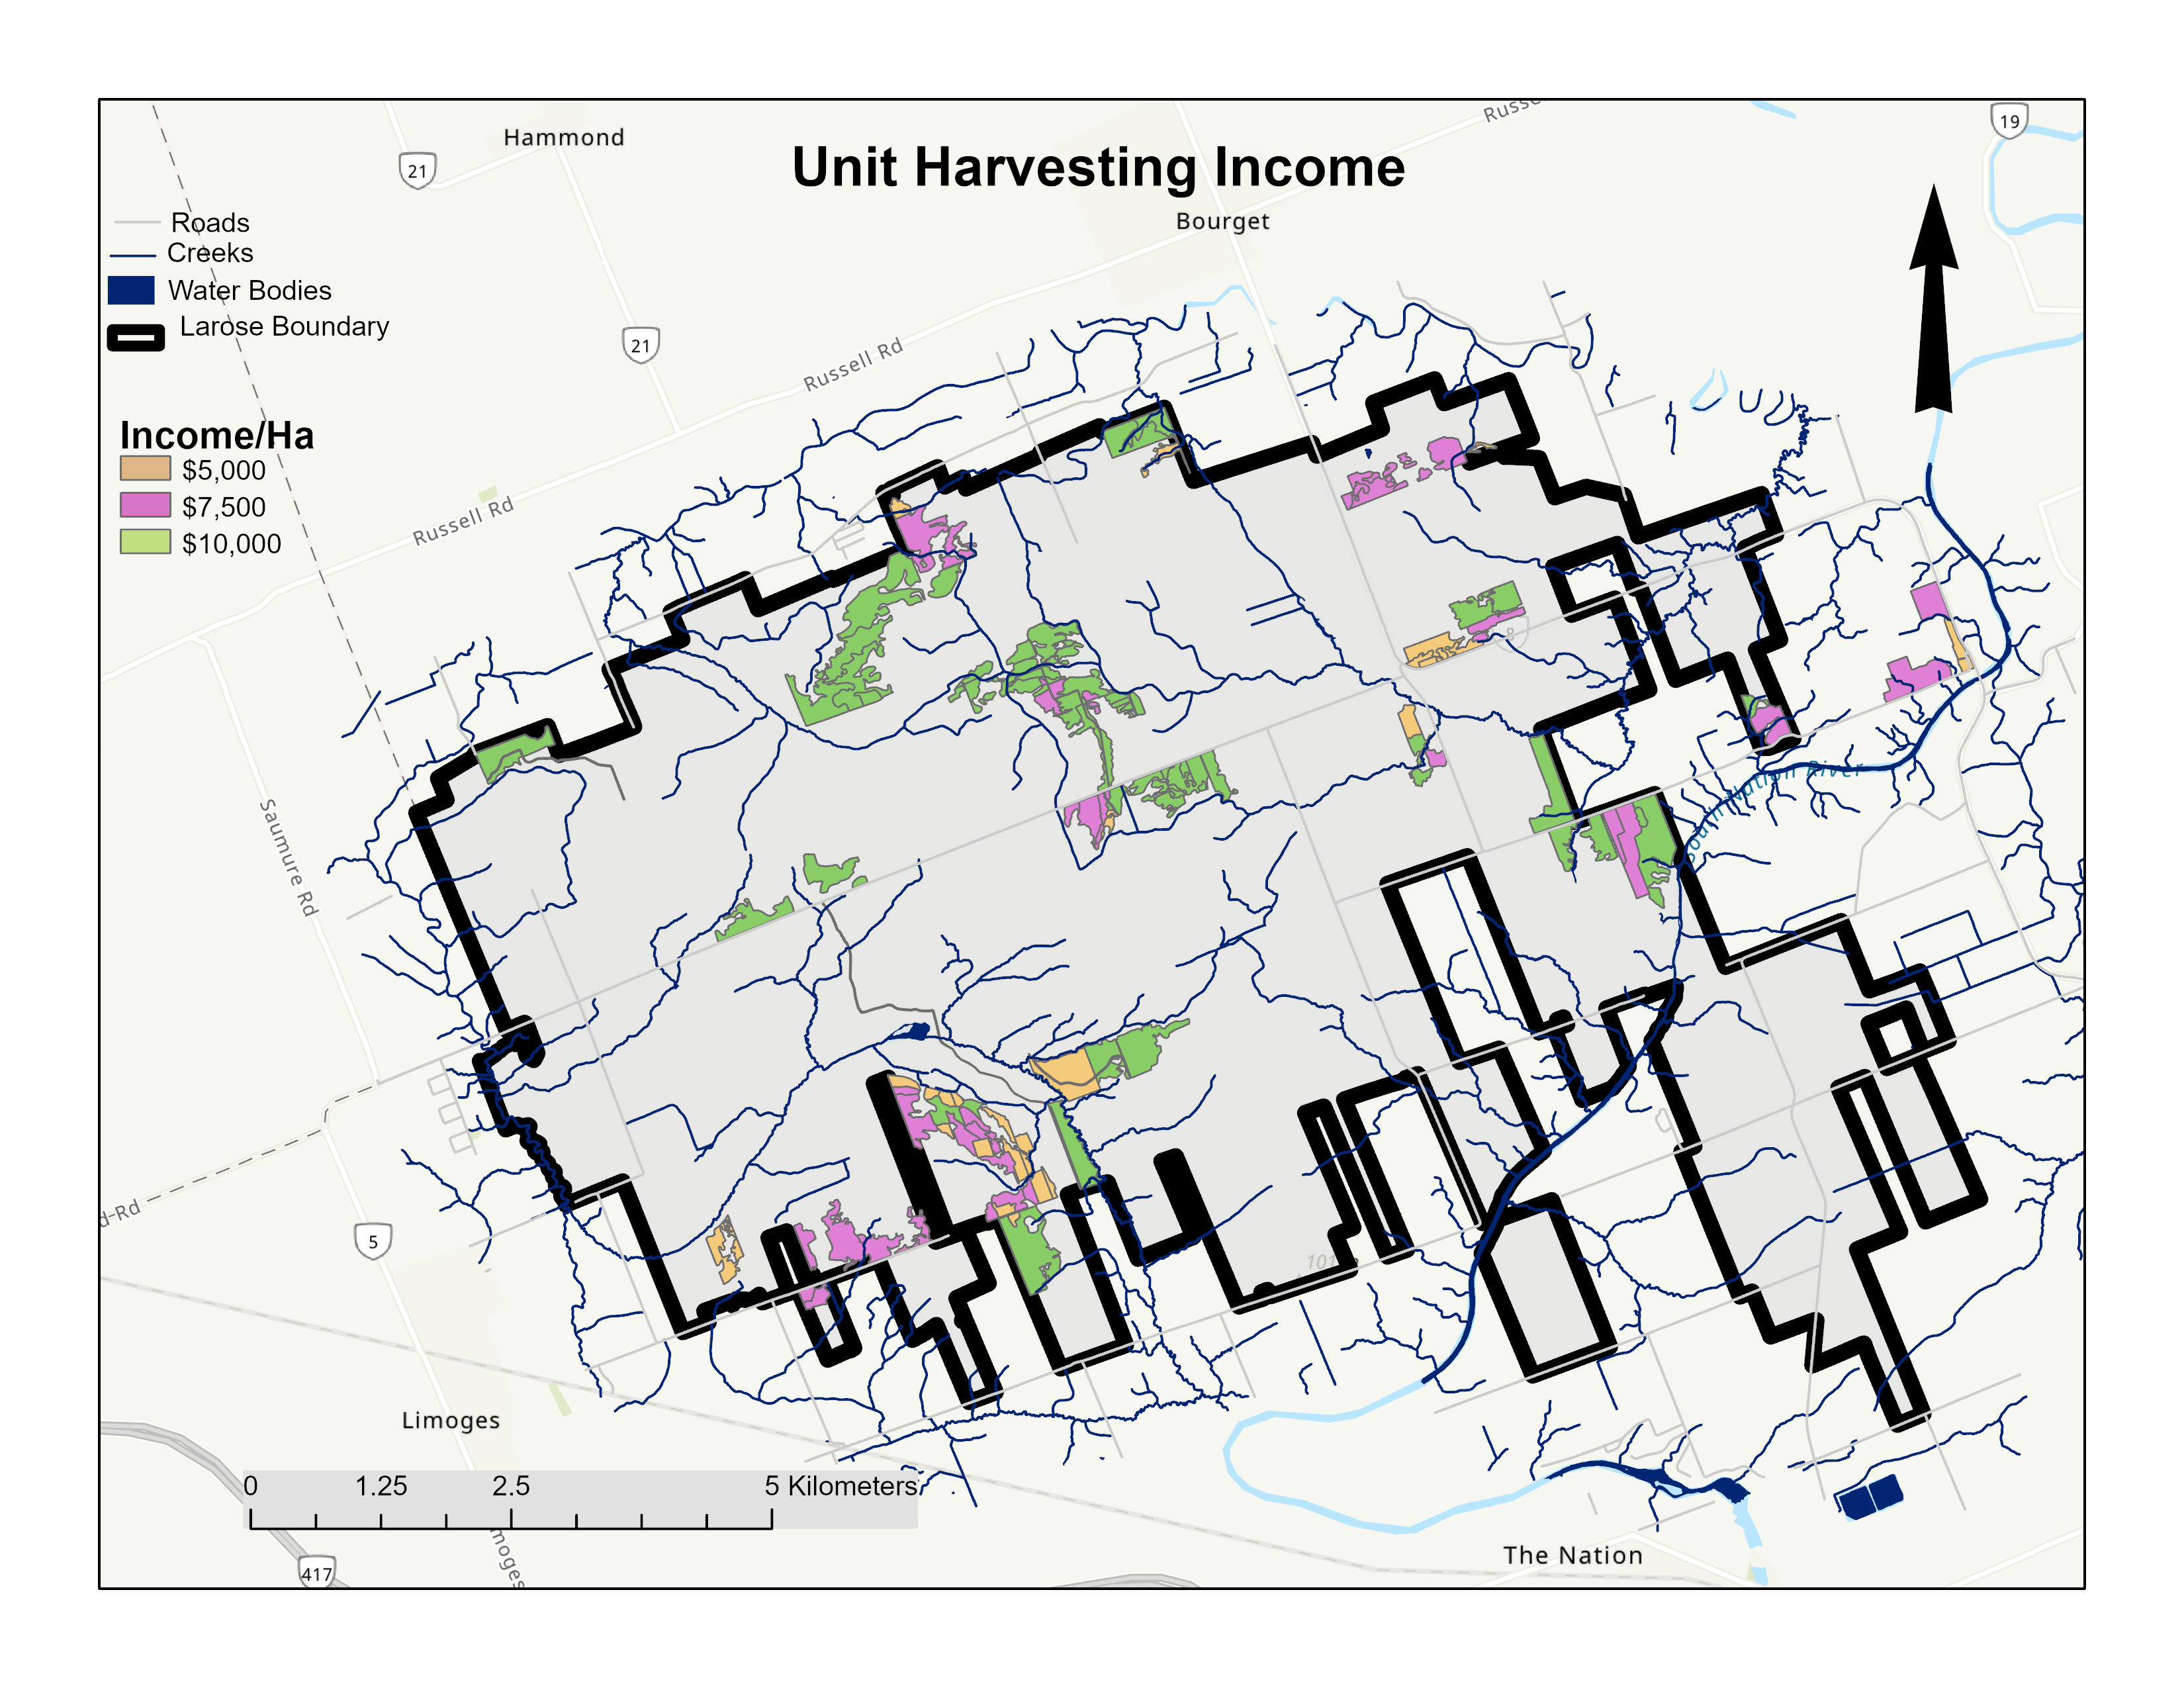
THe figure below shows the estimated income/hectare used as input values to the model for the proposed harvest areas in the 2022-2025 time frame.
Creating a Web App Using Experience Builder
This segment in our methodology covers the process of building the web app that our client could use to reach out to the public about forest management and explain how trails may be impacted.
Why Experience Builder?
Experience Builder allows the user to build attractive web apps without having to write any code. There are several widgets and tools to choose from to enhance the user experience of the webapp. These features can be dragged and dropped seamlessly into the web app design view. These tools include map centric tools, data centric tools, web page elements (text and images), menus, tool bars as well as page layout templates. Web Apps can be deployed on mobile, tablet and desktop screen with a responsive design.
Process
In preparation for building the Experience Builder web app, our team created a Shared Update group on our client's AGOL account to allow all team members to contribute to the editing. Next, Web Maps, 3D and 2D Scenes, images and text were added to the relevant pages. The web app consists of the three following pages: Home Page, Woodlot Merchandisable Income Page and Recreational Trail Rerouting Page. A black background with green headings and white text have been chosen. More information regarding the content of each page can be viewed in the solutions page.